Monday, January 8, 2024
Public Safety & Emergency Services
Tuesday, January 9, 2024
Economic Development Education & Culture

Public Safety & Emergency Services
Economic Development Education & Culture
A survey respondent said that some of the biggest problems in Broome County are: “racism, classism. homophobia, ableism.” These are problems across the country, and Broome County is no exception. Discrimination presents barriers to good health for all people.
Lack of knowledge and resources also causes gaps in health equity. Learn about how sociodemographic factors can affect health, where we may have gaps in local knowledge, and explore resources available for different groups of community members.
Learn more about why equity is important to health:
What is health equity and why is it important?
Language is constantly being updated as the world and the people in it change. Learn about words or phrases that are generally considered best to use when talking about groups of people who aren’t you by reading this Guide to Inclusive Language:
APA Guide to Inclusive Language
Explore health equity strategies by watching webinars, reading blogs, or following action toolkits.
Only 2.82% of 2022 Community Health Survey respondents were under the age of 18 and 13.1% were over the age of 65. These are important gaps in feedback, as children and older adults are among the most vulnerable to health challenges.
We all face different health challenges throughout our lives, and it is important to be aware of some of the dangers that we will face at different stages. Hover over the bubbles below to see some of the most common challenges facing different age groups in Broome County today.
The survey respondents’ racial demographics were similar to those of the county as a whole. See the county demographic profile for a breakdown.
The country and our county have legacies of discrimination on the basis of race and ethnicity. Though laws have changed to make systems appear more just for everyone, health statistics show that much more is needed to ensure that everyone has the same opportunities to be healthy.
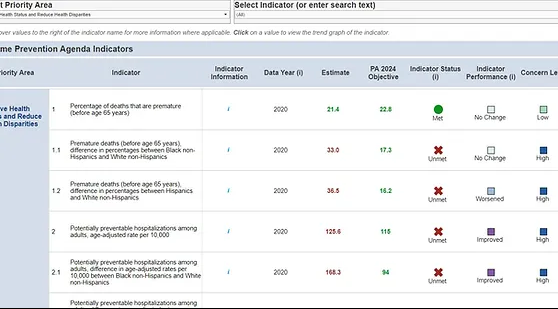
To the right is a color-coded version of NYSDOH’s County Health Indicators by Race and Ethnicity, which shows health disparities for Broome County.
Local groups that promote health equity around race or ethnicity include:
Binghamton University Division of Diversity, Equity, and Inclusion
Survey results were biased towards female respondents. Female-identifying individuals were 68.75% of respondents, males were 28.58%. 1.2% (30 people) of survey respondents identified themselves as nonbinary, 1.5% (38) preferred not to say.
People have unique risks based on their gender. See the Health People 2030 Objectives below to learn about national health risks and goals:
| Women | Men | Nonbinary/Trans/LGBTQ+ |
|---|---|---|
This year we did not collect data on sexuality through our survey, and no local data exists on NYS dashboards that would help to illustrate some of the unique risks faced by the local LGBTQIA+ population.
To learn more about health risks facing different LGBTQIA+ individuals, and to view resources, navigate to:
| National | Local |
|---|---|
People with degrees are slightly overrepresented in survey responses. Only 5.44% of respondents had less than a high school education when actually 7% of Broome residents do.
Healthy children generally do better in school and engage in more protective behaviors and fewer risky behaviors. Health and academic achievement are not equally accessible to all people. Lower educational attainment is associated with a number of health risks. To learn more and to view health strategies related to education, navigate to:
The income of respondents was similar to the income of Broome residents. 13.3% of people in Broome County living at or below the federal poverty line.
Not having enough money can impact every aspect of someone’s health. To learn about economics and financial security, navigate to Economics. To learn more about national goals/ frameworks for change, navigate to:
3.26% of survey respondents were not working at the time of their response due to a disability, while the number of people living with a disability in Broome is much higher. Some disabilities are visible, and some are not. Some are present at birth, and some develop later on. Many disabilities could pose barriers to engaging with a survey like the one that we put out.
See the printable resource guide below for a list of local resources for people with disabilities:
Our survey was only available in English, which means we likely did not get responses from many people for whom English is a new language or who don’t speak English at all. Most local public health educational resources, including this dashboard, are also only available in English. This is likely a barrier to health equity for 9.7% of the population of Broome County, who speak a language other than English at home.
A local resource for immigrants and community members who are learning English as a new language is the American Civic Association. Many organizations, including Broome County Health Department, use the Language Line to translate conversations with people who do not speak English fluently.
Religion plays a large part in many people’s lives and has an effect on attitudes towards different types of healthcare.
Some survey respondents expressed that religion should have a bigger role in healthcare and daily life while others think it should have less of a role. Changes you’d like to see to make it a healthier place: “more secular/ humanitarian organizations, less religion.” “The upholding of the sanctity of life from birth through natural death.” “The spreading of the Gospel and the unity of the separated brethren with the Catholic Church.”
Religious institutions often are often places where people can go for resources and for community. Find a religious institution near you:
Should we actually include? It affects the information you hear and what you trust. changes to make it healthy – “bad government officials.” “less government.” “stay out of the way and let the government decide.” problems: “Ignorance.” “Ignorance.” “Liberalism.” “Overreaching government.”
Proposed Resolutions
Committee Meeting Agendas
Committee Meeting Minutes
Resolutions Corrected/Amended
Session Agenda
Session Minutes
Adopted Resolutions
County Administration Committee Meeting Minutes
Finance Committee Meeting Minutes
Public Safety & Emergency Services
Economic Development Education & Culture
*Click on the icons below to see local resources that promote food security. Click the three lines on the left to see what different symbols mean. MAP LOADS SLOWLY.
Looking for local organizations and resources?
211 Printable Resource Guide: Food Resources
Women, Infants, and Children (WIC)
Supplemental Nutrition Assistance Program (SNAP)
Broome County’s Resource Guide: Food and Nutrition
Resources to support healthy eating:
6 Tips for Eating Healthy on a Budget
MyPlate – Healthy and Delicious Recipes
Education and media about food insecurity:
Food security means always having enough access to food, including healthy food, and food that we like and will eat. Food insecurity, on the other hand, is when we can’t afford healthy or culturally appropriate food or can’t access it. This food might be too expensive, too far away, or just not available for some other reason. Food insecurity affects over 34 million Americans, including 9 million children. In 2021, over 10% of families in the United States were food insecure.
Food insecurity is immediately caused by a lack of money or other resources. Although emergency food services like shelters, soup kitchens, and food pantries help, they won’t make food insecurity go away. The root causes of food insecurity have to do with social inequity and climate change. Despite the dramatic increase in use of emergency food services in the US over the past four decades, food insecurity persists. Solutions should be climate-friendly and aim to change social systems.
Food insecurity affects health in direct and indirect ways. Irregular eating patterns, like going without meals for long periods of time, can lead to fluctuations in blood sugar levels and increase the risk of developing type 2 diabetes. Hunger is painful and can lead to weakness, headaches, dizziness, stomach pain, and mood changes. Prolonged hunger can lead to malnutrition, weakened immune system, weight loss, and mental health problems, among other consequences. Other challenges arise from only eating cheaper foods. Cheaper foods are often less nutritious, with more added sugars, saturated fat, and salt and less fiber, protein, and vitamins. Diets that are limited by finances often lead to chronic diseases, like type 2 diabetes or obesity.
Food insecurity affects a significant portion of the population, but certain groups are more vulnerable than others. The causes of food and nutrition insecurity are complicated. Social factors like low income or unemployment, lack of access to nutritious food, lack of affordable housing, and lack of healthcare are among the main contributors to food and nutrition insecurity.

Low wages, lack of access to affordable housing, high healthcare costs, or other factors can contribute to limited budgets for food. Learn more
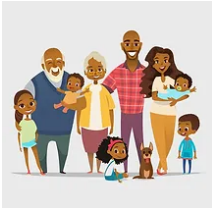
Single-parent households are more likely to experience food insecurity than two-parent households. Learn more
Households with children may find it difficult to afford enough food for everyone. Learn more | See Statistics
Older household heads, especially those who are retired and living on fixed incomes, are more likely to experience food insecurity than younger householders. Learn more

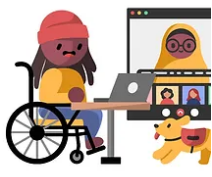
Disability looks different in different people. For some, their disability is a barrier to accessing enough healthy food. Learn more

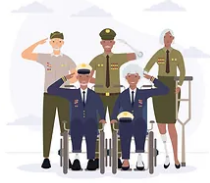
11.1 % of veterans between the ages of 18 to 64 are food insecure. Learn more
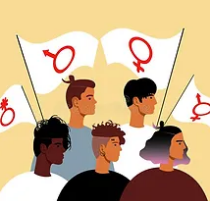
30.2% of women who live alone or as single parents face food insecurity. The rate is higher for women of color. Learn more
27% of LGBTQ adults did not have enough food at some point in the past year in 2019, compared to 11% of the general population. Learn more

Rural Americans are more often food insecure than the general population is. Learn more
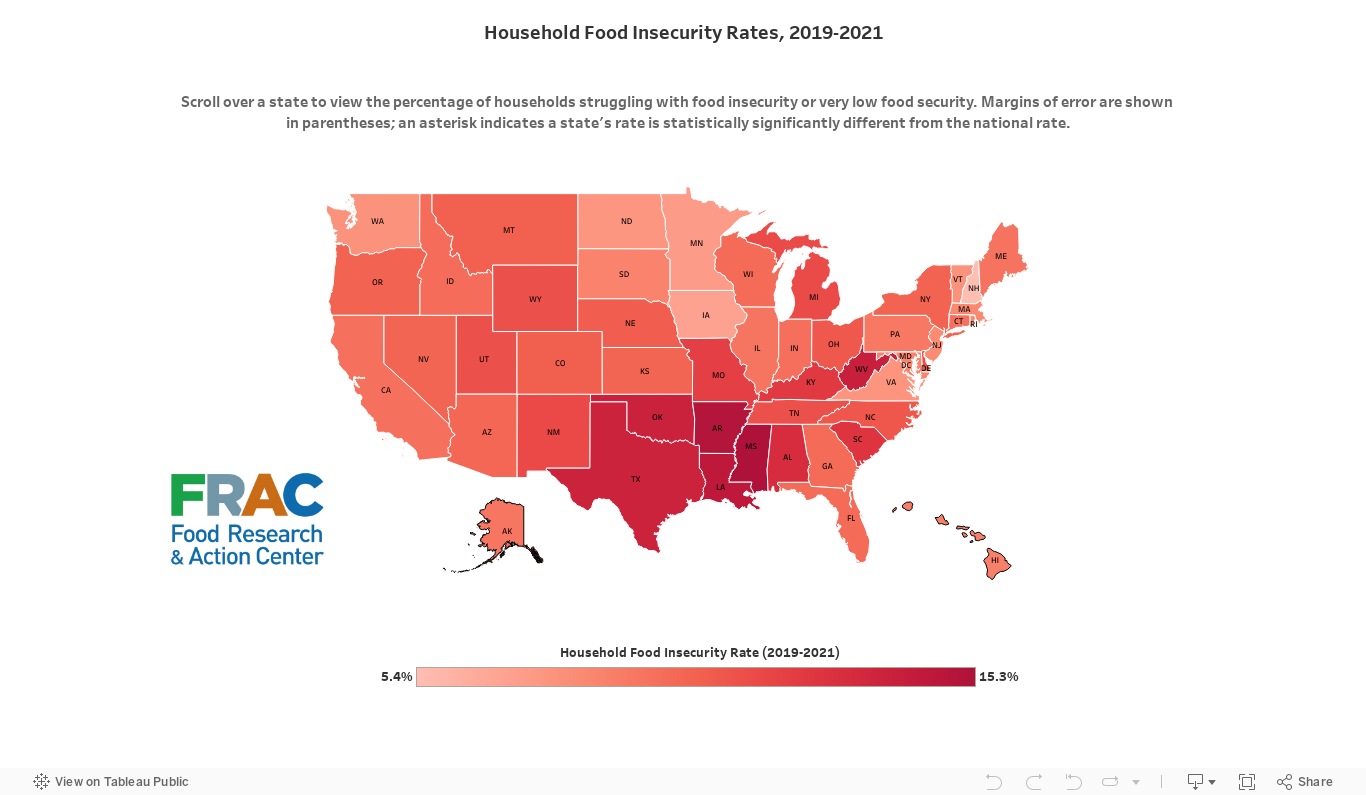
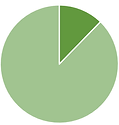
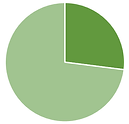
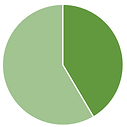
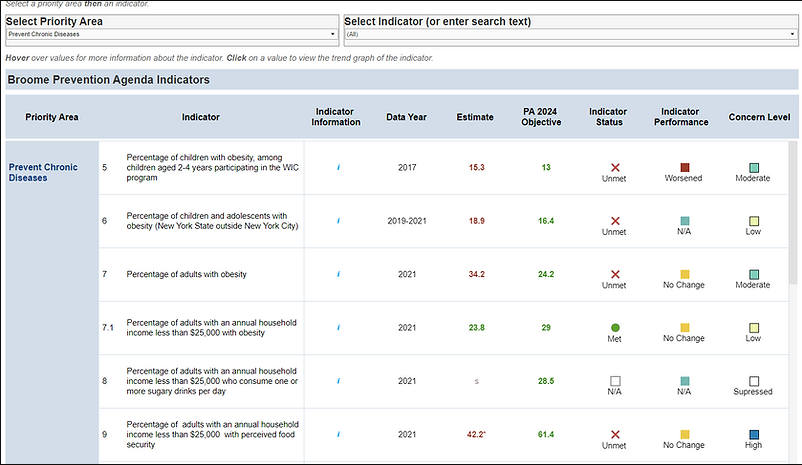
The problems of food insecurity, limited access to healthy foods, and obesity among adults and adolescents affect a significant portion of people in Broome County. The data below is taken from the 2022 Broome County Community Health Survey and the County Health Rankings and Roadmaps website (2020 data).
| 4% | 13.8% | 37% | 71% |
of people in Broome County have limited access to healthy food. 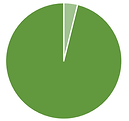 |
of people experience food insecurity.
|
of adults (18 and older) are obese.
|
of surveyed residents are concerned about adult overweight/obesity
|
NYS Community Health Indicator Reports

To address food insecurity, we plan to:
BCHD: WIC has provided a total of 16,870 reduced-fat WIC food packages as of June 2022.
Improvement: The % of children (2-4 years) participating in the WIC program with obesity has decreased from 15.3 to 8.7
Worsened: The percentage of adults ages 18 years and older with obesity, increased from 25.7% to 30.7%.
FEN: 32 providers enrolled in CACFP
Throughout 2020-2021, B-T BOCES schools purchased $1.5 million (149,405 pounds) in NY products served during lunch.
OFA: The senior centers re-opened in June 2021 and had 6562 participants in their HP classes. As of October 2022 there have been 5,849 participants YTD.
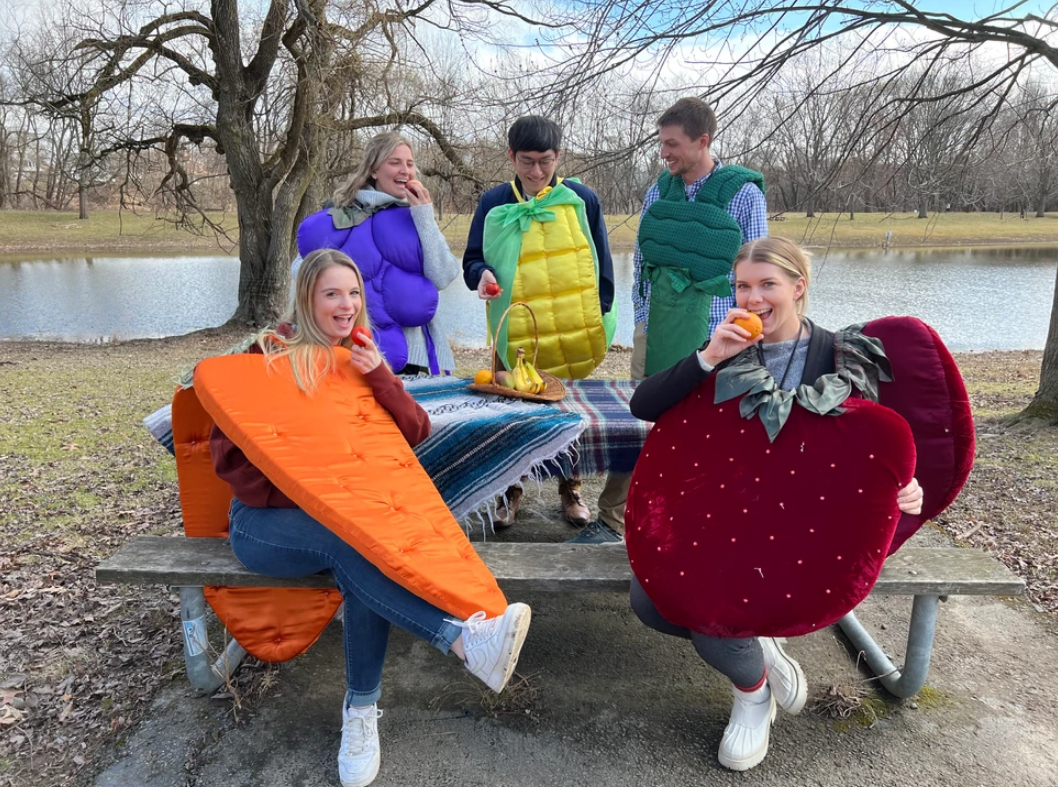
RHN: 15 taste tests scheduled for the 2022-2023 school year. 2,130 students participated in taste tests held in 2021-2022.
CCE: 4298 youth reached through SNAP-Ed program
Lourdes: As of 2022 for all active patients, on average, patients experience a weight loss of 13%. BMI reductions also respond accordingly. There are currently 550 active participants and 100 that are categorized as “maintenance.”
RHN: 89 people in Endicott in Prx program, 32 in JC.
CCE: 409 participants in chop n chat program in 2022.
OFA: coupons for farmers market distributed to 860 seniors in 2022. In 2022, OFA served a total of 46,663 meals within 8 senior centers. As of September 2022, Meals on wheels served 139,635 elders.
CCE: 15 vendors at the farmers market accept SNAP/EBT, Veterans Coupons, WIC FMNP, Fresh Connects, Produce RX, and Senior FMNP.
WIC- In 2022, 80 WIC eligible households were referred by a healthcare provider site/22 WIC eligible households were referred by hospitals.
UHS: 20 VINES spots for patients
CCE: Around 50 individuals use SNAP/EBT at the market each month (~350 transactions since January 2023 totaling $6,956.00), we had $3,698 in Fresh Connect Sales, $1,536 in ProduceRx sales, $339 in Veteran Coupons, $126 in Kids POP Club Coupons, FMNP coupons are not for redemption until July through November (2022 totals for FMNP redemption totaled $23,000). In addition, our farmers have donated 2,231 pounds of food to Binghamton Food Rescue since January 2023.
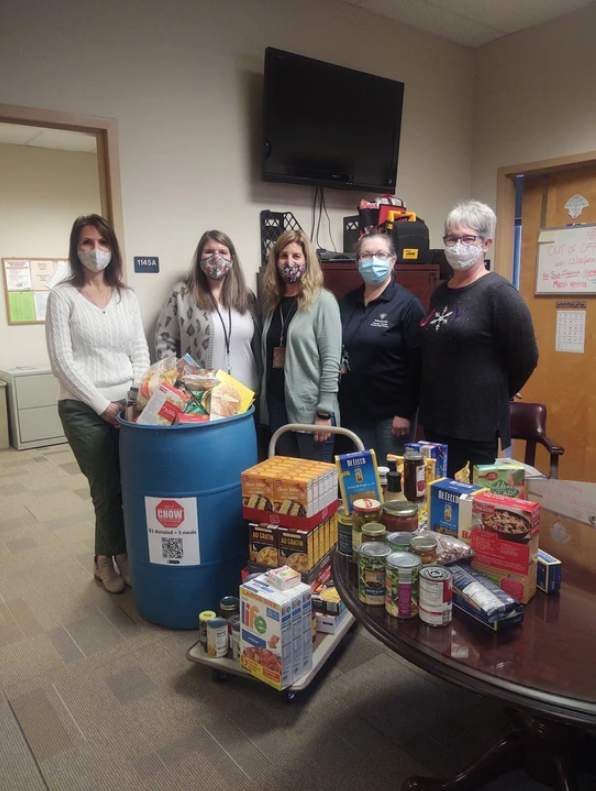
CHOW: Improvement: In 2021, Broome CHOW rescued 1.8 million pounds of food for the community. In 2022, 2.5 million pounds.
CHSC: ACBC food pantry serves between 350-400 individuals per month, approximately 4500 individuals per year.
Catholic Charities: In 2022, Mother Teresa’s Cupboard served a total of 6,626 people, 100 Main St. Binghamton served a total of 23,259.
St Cyril: As of 2022, served a total of 56,429 residents in Broome County averaging around 61,000 lbs. of food per month.
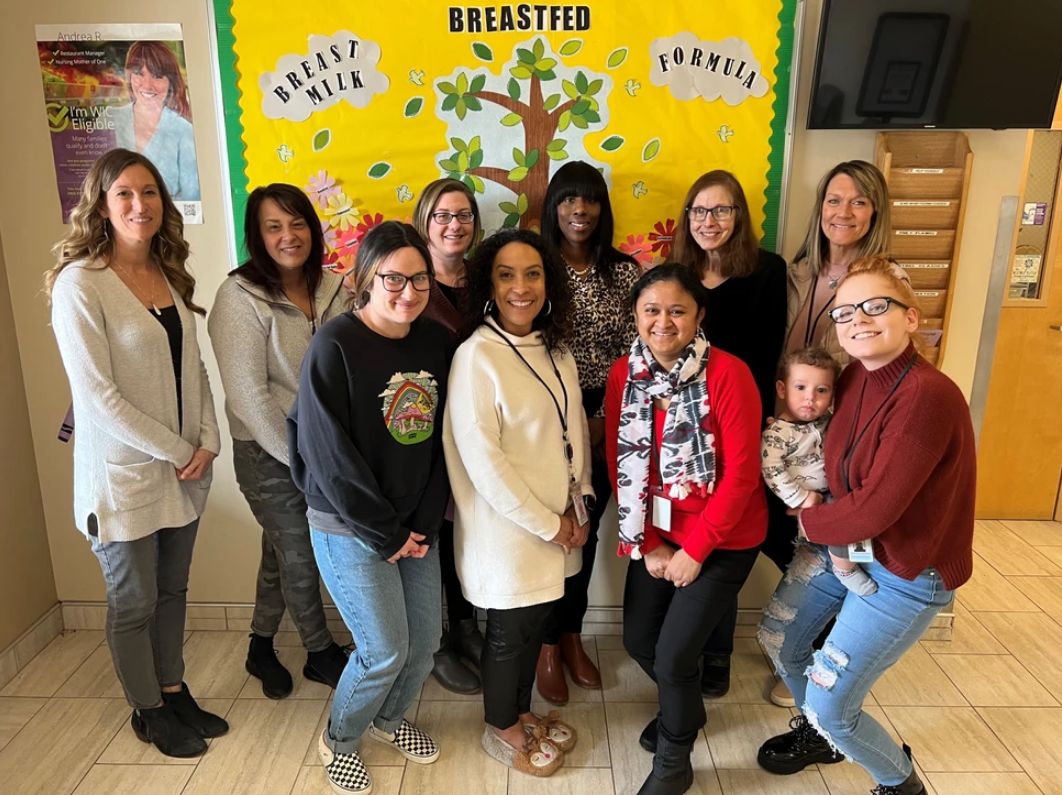
UHS: (2022 as of 11/09) # of deliveries (1,320) # of moms who exclusively breastfeed (1,024), # of moms who combo breast feed and formula feed, # of moms who exclusively formula feed (262). Deliveries from 7/1/2023 – 6/29/2023 = # of deliveries (1,622) # of moms who exclusively breastfeed (698, 43.03%), # of moms who combo breast feed and formula feed (458, 28.24%), # of moms who exclusively formula feed (449, 27.68%), and # of moms who have an “other” feeding documented (17, 1.05%).
Lourdes: 11/09/22, 644 deliveries with 564 breasted and 77 formula fed.
WIC: virtual infant feeding classes (36 families have attended the virtual infant feeding class YTD)
RHN: RHN provides 365 PRX slots in Broome County. Participants have been maxed out at 52 for the Lourdes program, with a waiting list.
The Food Bank of the ST contributes food and other items to 45 food pantries in Broome County. With 12 of the locations offering deliveries, 15 locations offering diapers, and 4 locations offering drive-thru services. Food Bank of the ST (2022 YTD) has had 51,682 household requests for food, 366,492 requests for food, 2,663,708 total pounds of delivered, 2,554,957 which were food.
HLC CCE: 978 individuals ages 6+ reached from 2021-2022 at community center based activities. 304 youth and 20 adults since January 2023.
Catholic Charities: Summer lunch program, In 2022 thus far, the Endicott location served 142 lunches, 31 unduplicated, Binghamton served 1444 lunches, 434 unduplicated.
CCE Community nutrition 2022: Reached 106 youth and 90 adults. Since January 2023 – direct education to 30 Broome County Veterans, 77 youth at Deposit Summer Camp, 47 participants in food preservation classes, 8 adults in pressure canner testing, and 631 youth in incubation and embryology classes.
CCE: Through SNAP-Ed nutrition program, reached 4,298 youth and 1421 adults with series and one-time classes. Through partnership with the United Way and the Healthy Lifestyle Coalition, CCE reached 304 youth and 20 adults with nutrition programming.
With Expanded Food and Nutrition Education Program (EFNEP), graduated 43 low-income adults and 127 youth with 6+ classes.
UL/CCE nutrition and education program served 50 kids ages 5-13. Children had an extra 30 minutes of exercise a day.
Each of these organizations is part of the plan outlined above. Representatives report on how their organization is working towards achieving county goals.


Do you or your organization want to help? Check out some other evidence-based strategies to address the food insecurity issues within the community.
About Food and Nutrition Insecurity (cdc.gov)
Household Food Security in the United States in 2021
Dietary Guidelines for Americans, 2020-2025
Household Food Insecurity Rates, 2019–2021
Food Insecurity Trajectories in the US During the First Year of the COVID-19 Pandemic (cdc.gov)
Public Safety & Emergency Services
Special Public Works & Transportation Committee Meeting
Economic Development Education & Culture